The Analytics Value Curve
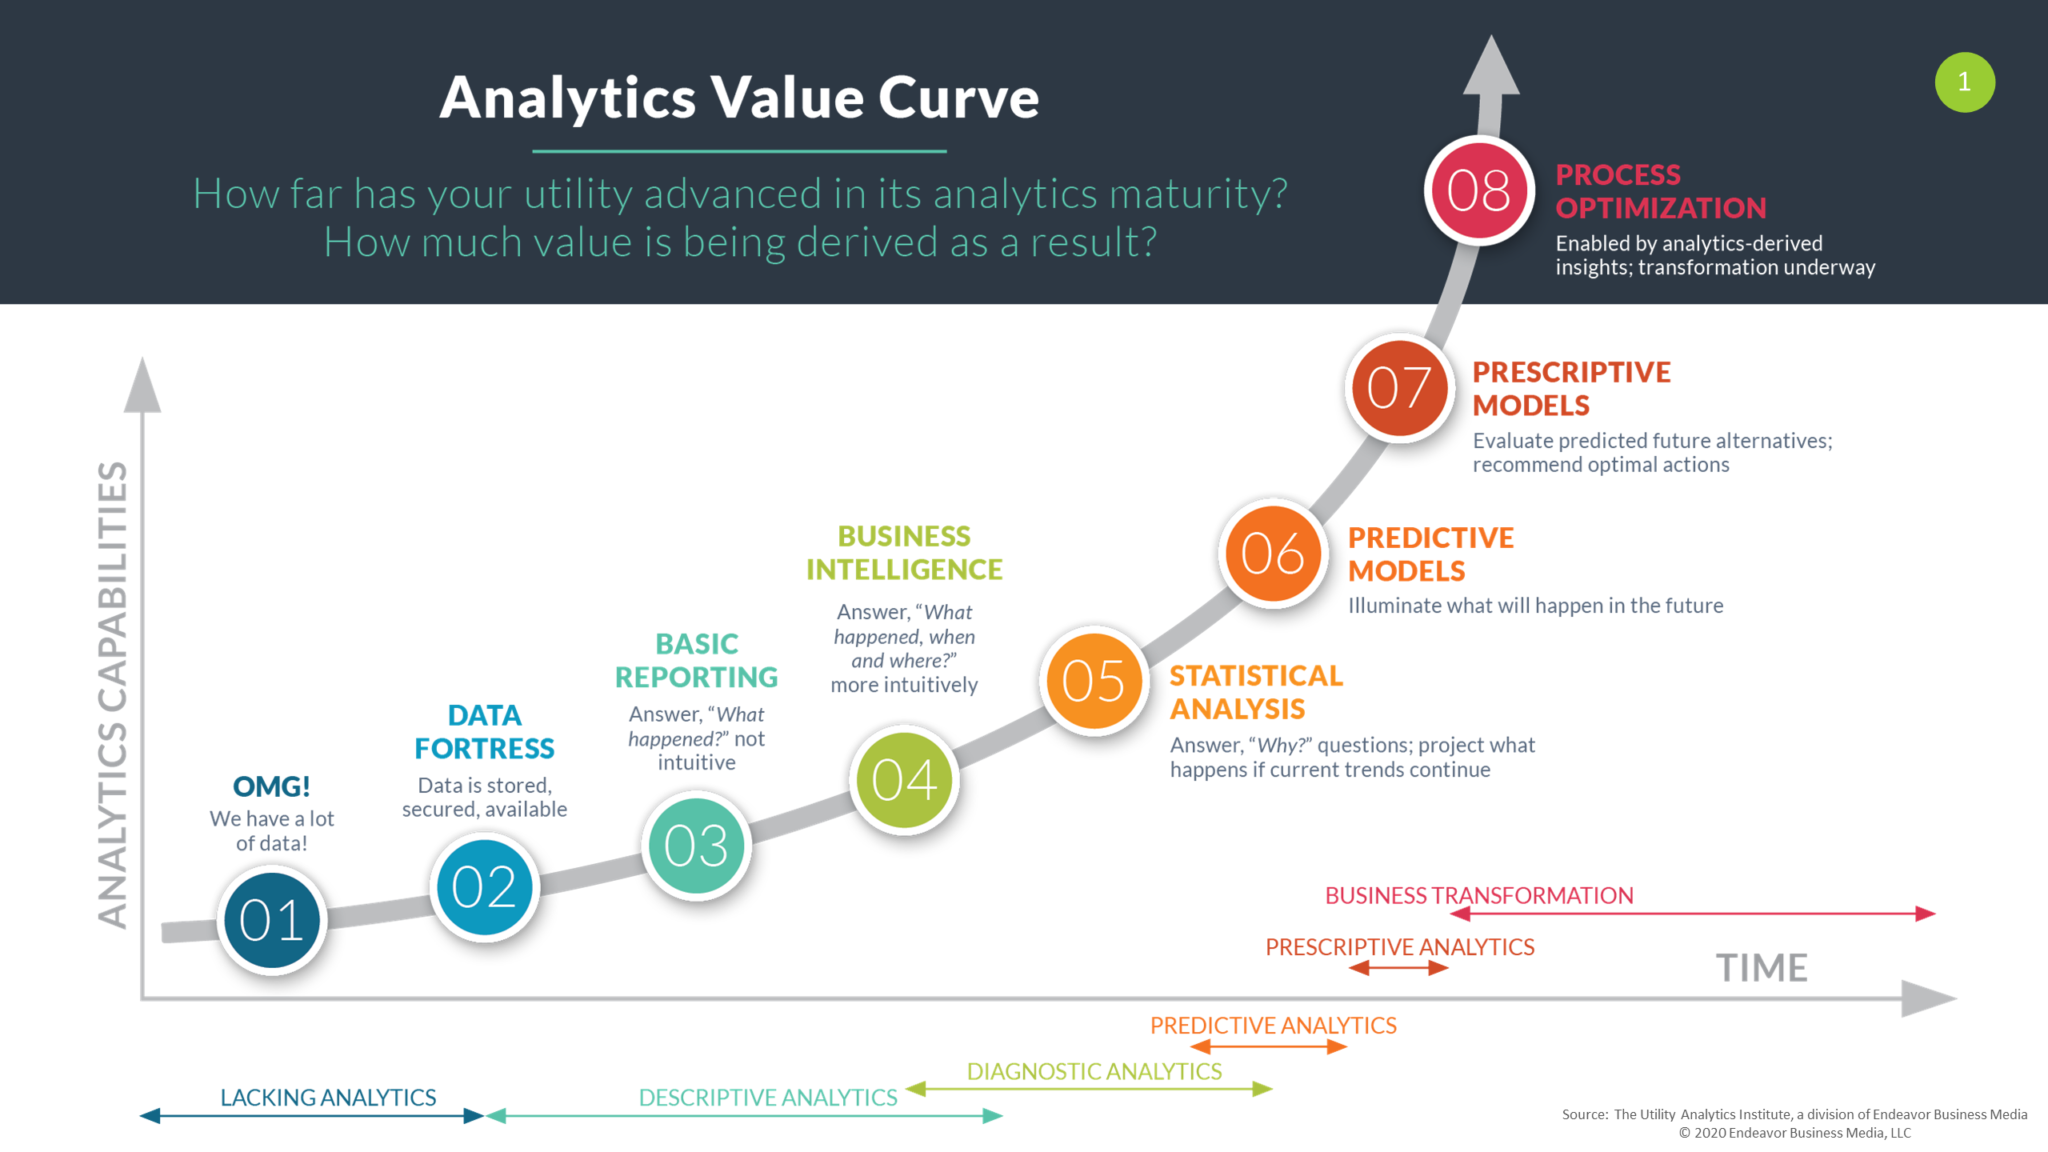
Below is an image I first encountered while working at a utility company called Consumers Energy. The graphic illustrates Thomas Davenport’s ideas from Competing on Analytics (Davenport and Harris 2007).
This is among my favorite analytic tools. I’ve used this framework to assess the analytic maturity of companies and teams I’ve interviewed with as well as to build data science road-maps for business units and products I’ve supported.
References
Davenport, Thomas H., and Jeanne G. Harris. 2007. Competing on Analytics: The New Science of Winning. Harvard Business Review Press.